Your cart is currently empty!
Analyze Data With R
What is “R”
You collected a data set using a GCDC logger and realized, “Wow, that’s a lot of data! Now what?”. Data analysis is tedious and the process is particular to each user’s application. Don’t expect to find a magic software solution that will reduce your data into your perfect answer. However, don’t despair. There are several options available, combined with a little bit of user effort, that provide powerful and versatile analysis capabilities.

Spreadsheets, such as Microsoft Excel or OpenOffice Calc, are great choices for plotting moderately sized data sets. The user interfaces are highly polished and customized plotting is easy to handle. However, most spreadsheets can handle only about 100,000 lines of data before performance begins to slow. Furthermore, scripting complex analysis procedures in a spreadsheet is cumbersome. We recommend trying “R” because it is more powerful than a spreadsheet and it is easy to learn.
“R” is a high-level programming language used most commonly for statistical analysis of data. R is based on the “S” language, which was developed by the Bell Laboratories in the 1970s. R provides a simple workspace environment that can manipulate large data sets using simple math commands and complex function libraries. R is widely used by statisticians and data miners, and the language is well supported by the open source community. The software is compact, free, and available for Windows, Mac, and Linux (visit www.r-project.org).
Matlab is another common software application for analyzing data but it is usually reserved to universities or businesses with copious budgets (it’s expensive software!). Octave is a free open source adaptation of Matlab with nearly all the same capabilities. However, Octave is a significantly larger download and more complicated installation than R. We favor R because it’s small, easy to learn, and free.
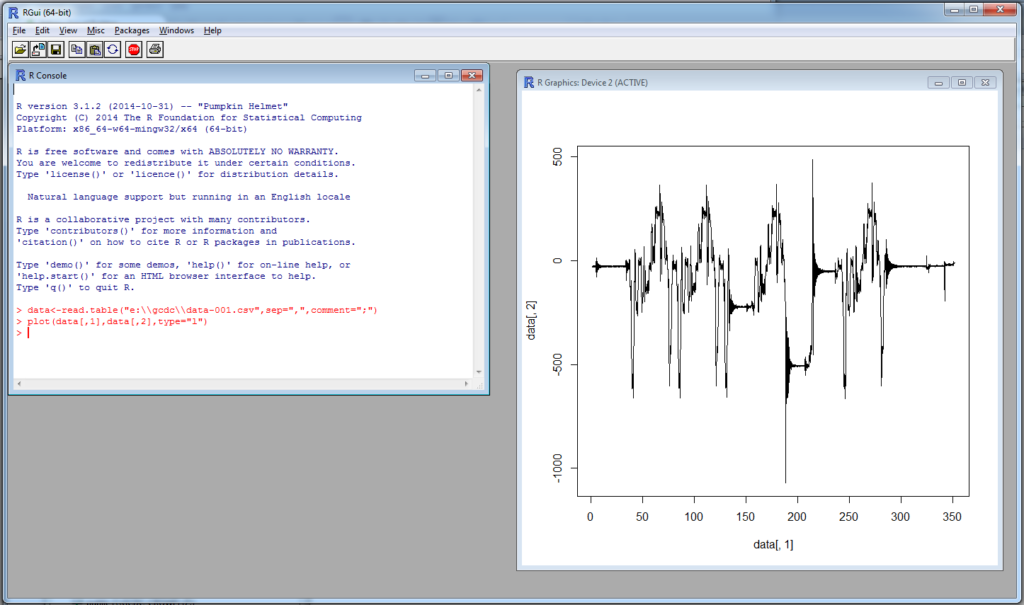
R is implemented from a command line interface, as seen in the above image. If you are an experienced programmer, you may even cringe at some of the constructs used in R. Don’t worry, it just works. User input occurs at the “>” prompt and the R interpreter responds with the results. A single result is preceded by a [1] to indicate the response number. The “;” character is used to add comment information that the R interpreter ignores.
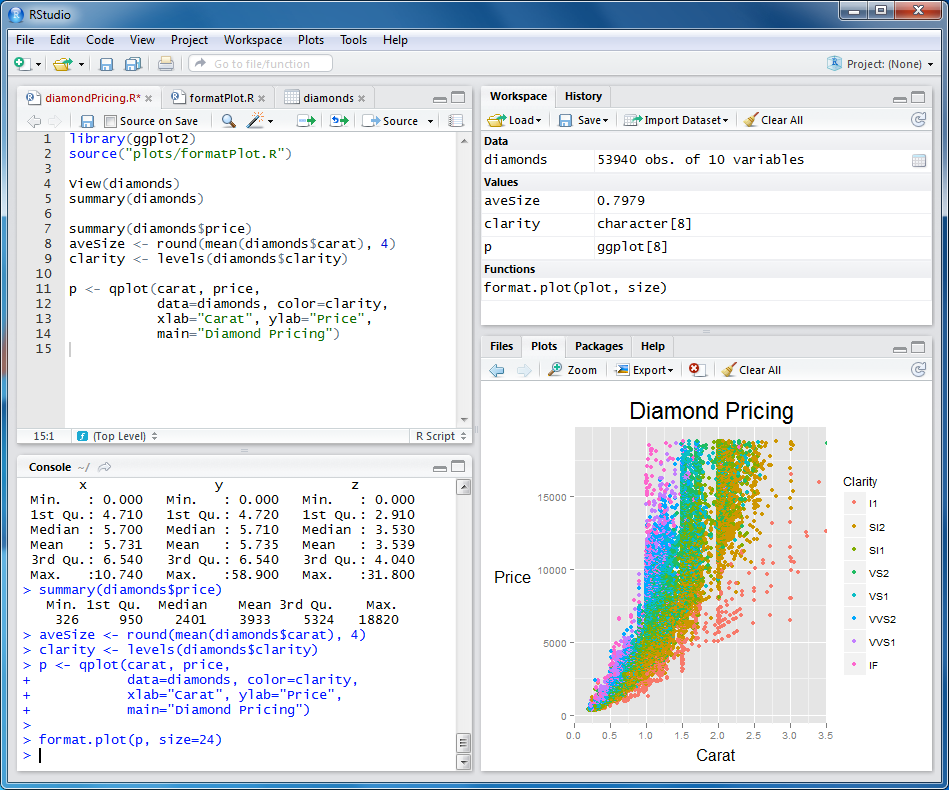
The R workspace includes a single command line interface window and a separate graphics window for displaying plots. “RStudio” is a free software package that provides a more versatile interface to the R interpreter as seen below. RStudio is available at Posit.co (note that there is a free version to download and the professional option is not required).
Introduction to R Commands
R recognizes basic math operators, such as +,-,*, and /. Assignments are made using “<-”. For example:
> 2+2
[1] 4
> a<-2+2	;assign “a” the result of 2+2
> a
[1] 4
In the above example, ‘a’ was assigned the value ‘4’ and can be used later. R works with vectors and matrices as well.
> b<-c(1,2,3)	;”c” is a function call that creates a vector
> b
[1] 1  2  3
> a*b
[1]  4   8  12
More complex math steps are handled in separate functions or external scripts.
> fun<-function(a,b){
+ c<-a+b		; the “+” indicates the user input wrapped into next line
+ return(c)
+ }
> fun(2,2)
[1] 4
R will read a data file from the X16-1E data logger using the “read.table” function.
> data<-read.table(“d:\\GCDC\\data-001.csv”, sep=”,”,comment=”;”, fill=TRUE)“data” is a matrix of 4 columns containing the time and Ax, Ay, and Az values from the file. Values within the matrix are accessed as follows:
> data[100,2] 	;row 100, column 2
[1] 101
> a*data[100,2]
[1] 404
The raw data is converted and assigned to new vectors.
> dataX_g<-data[,2]/2048   	;convert the x-axis to g and assign to new vector
> dataY_g<-data[,3]/2048
> dataZ_g<-data[,4]/2048
Now, the acceleration in g’s is plotted against the elapsed time.
> plot(data[,1], dataX_g, type=”l”)	; create a line plot of x-axis values
> lines(data[,1], dataY_g, type=”l”, col=”blue”)	; add another line to plot
The converted data can be combined into a new matrix and then exported to a new csv data file.
> output<-array(c(data[,1],dataX_g, dataY_g, dataZ_g), dim=c(length(data[,1]),4))
> write.table(output, “c:\\output_data.csv”, sep=”,”)
An analysis can be automated by saving the commands into an external text file. Use “source” to call the file and R will execute the script inside workspace.
>source(“d:\\hello_world.r”)
[1] hello world
Documentation of the available commands is accessed using “help” or by using an internet search engine.
> help(“plot”) ; opens a browser with the help documentation for “plot”Online Resources for R
Home page for R to download the software:
A complete introduction to R:
https://cran.r-project.org/doc/manuals/r-release/R-intro.html