Step by step instructions:
Step 1: Buy an X16-1E or X16-5 logger
Step 2: Download and install R from cran-r.project.com. Why R? R is a simple scripting language used primarily by statisticians for analyzing large data sets. The program is self contained, well supported with many libraries, easy to learn, and it's free! The language is a little quirky but very powerful once you learn the system. We could use Matlab or Octave (the free equivalent of Matlab) but those are either expensive (Matlab) or difficult to install (Octave).
Step 3: Download and save the coaster_analysis script to the data logger. You can use the data file we collected from the Hulk ride as an example file to analyze. (this is a 8MB file)
Step 4: Go to your favorite theme park and collect data on a roller coaster.
- Configure the data logger to collect constantly at 800Hz. The fast sample rate will pick up the roar of the Hulk coaster. However, you may reduce the sample rate to 50Hz to capture just the coaster motion. Here is an example configuration file:
             Samplerate=50
             deadband=0
             deadbandtimeout=0
             samplesperfile=90000
             statusindicators=normal
- Prior to boarding, start the logger by pressing the on/off button. You can keep the logger in your pocket during the ride but attaching the logger to the coaster car results in better data. If you are especially brave, collect data from multiple rides but at different positions on the car or person (shoe, pocket, hat). Are there differences? We like to use Command Strips from 3M to adhere the logger to the coaster car. The strips hold tight and release easily by pulling the tab.
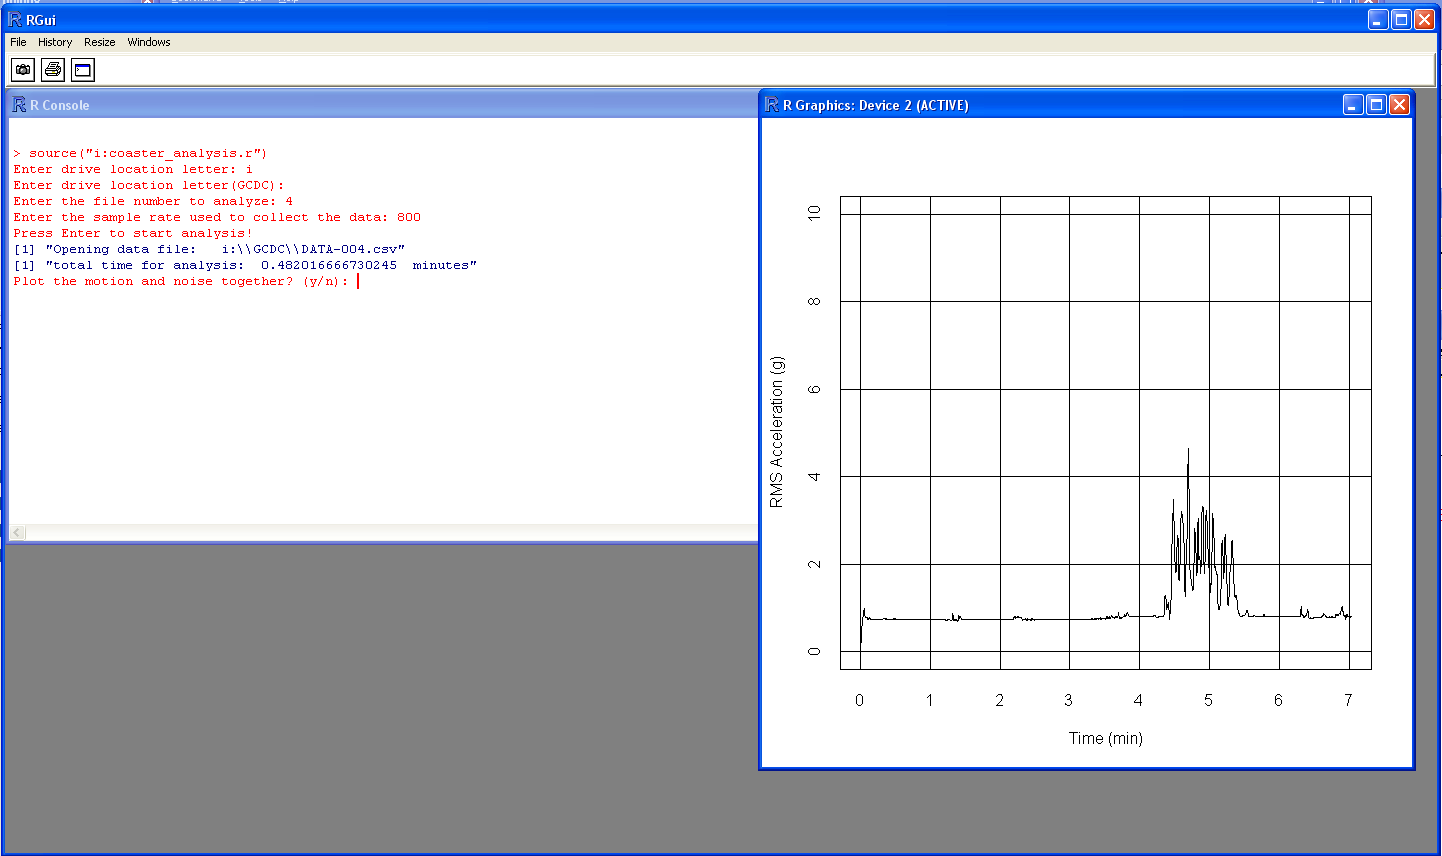
Step 5: At home, plug the logger into a PC and start R. At the R command prompt, enter source("h:coaster_analysis.r") to start the R script. The drive letter may be different in your particular case. Follow the prompts.
- enter the drive letter of the logger.
- enter the directory of the data files (the default is GCDC but you can define another location if necessary).
- Enter the file number to analyze, such as "104" for the example data file.
- Enter the sample rate. Enter 800 for the example data file.
- Press enter to start the analysis
- The script will plot the RMS acceleration versus time (low frequency motion). The script simplifies the analysis by combining all three axes into one root-mean-square (RMS) value. This shows the total combined acceleration during the ride instead of directional values for forward and lateral g's.
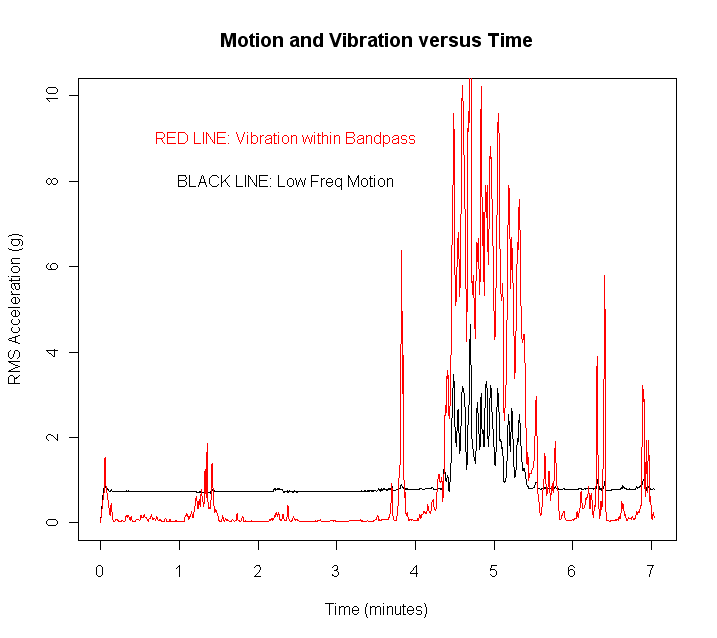
- The script will prompt you to plot the motion vs noise. In the case of the Incredible Hulk roller coaster, the noise plays a prominent roll in the coaster experience. The noise is isolated using a bandpass filter between 185Hz and 205Hz. Other roller coaster will not show this signal so you can skip this plot. Or, modify the script to see other bandpass responses.
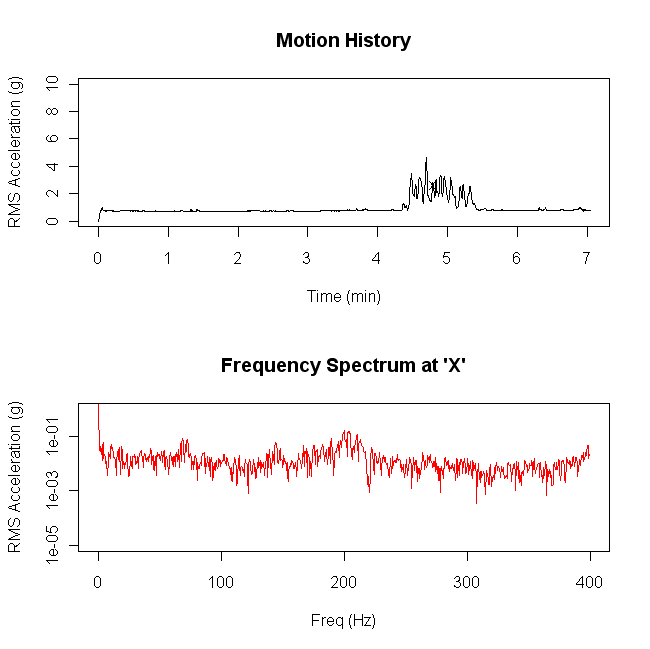
- Next, the script will ask to plot the motion and spectral response together as an animation. The performance of the animation will vary depending your computer's speed.
- Finally, the script will ask to save the analysis results to a text file on the logger. This is useful if you want to plot the data in Excel or perform further analysis on the results (for example, compare two different roller coasters). Data is saved in tab deliminated text format with 4 columns: sequence, time (seconds), motion acceleration (g), noise acceleration (g).