Introduction

Many tires today can last up to 60,000 miles, but tire manufacturers recommend an age limit of about 5 years. As a tire ages, the vulcanized rubber degrades and the tire becomes less pliable, surface cracks appear, and pieces of rubber can dislodge. Furthermore, it's common to have balancing weights shift on the rim or break off. These factors combine to cause imbalances, which makes the car vibrate, noisy, and uncomfortable to drive. A set of new tires can resolve these balance issues and provide a significant improvement to the ride.
A detailed description of the test procedure, analysis method, and results are documented in our test report Vibration Analysis of New Tires. The R-script and example data is also available for download.
Objective
The test analyzed data collected from an X2-2 accelerometer data logger to evaluate and compare car vibration on two different road courses, before and after installing new tires. The experiment used our older X2-2 logger but the prcedure and analysis method is still applicable using our newest X2-5 logger
Procedure
Listed below are the configuration settings of the X2-2 logger. The file size was set to a 2 minute length to help group the test conditions.
    ;X2-2 configuration
    ;set sample rate
    ;available rates 4, 8, 16, 32, 64, 128, 256, 512
    samplerate = 256
    ;record constantly
    deadband = 0
    deadbandtimeout = 0
    ;set file size to 2 minutes of data
    samplesperfile = 30720
    ;set status indicator brightness
    statusindicators = Normal
    stoponvusb
    ;rebootOnDisconnect
    microres
    gain = low
    ;see user manual for other config options
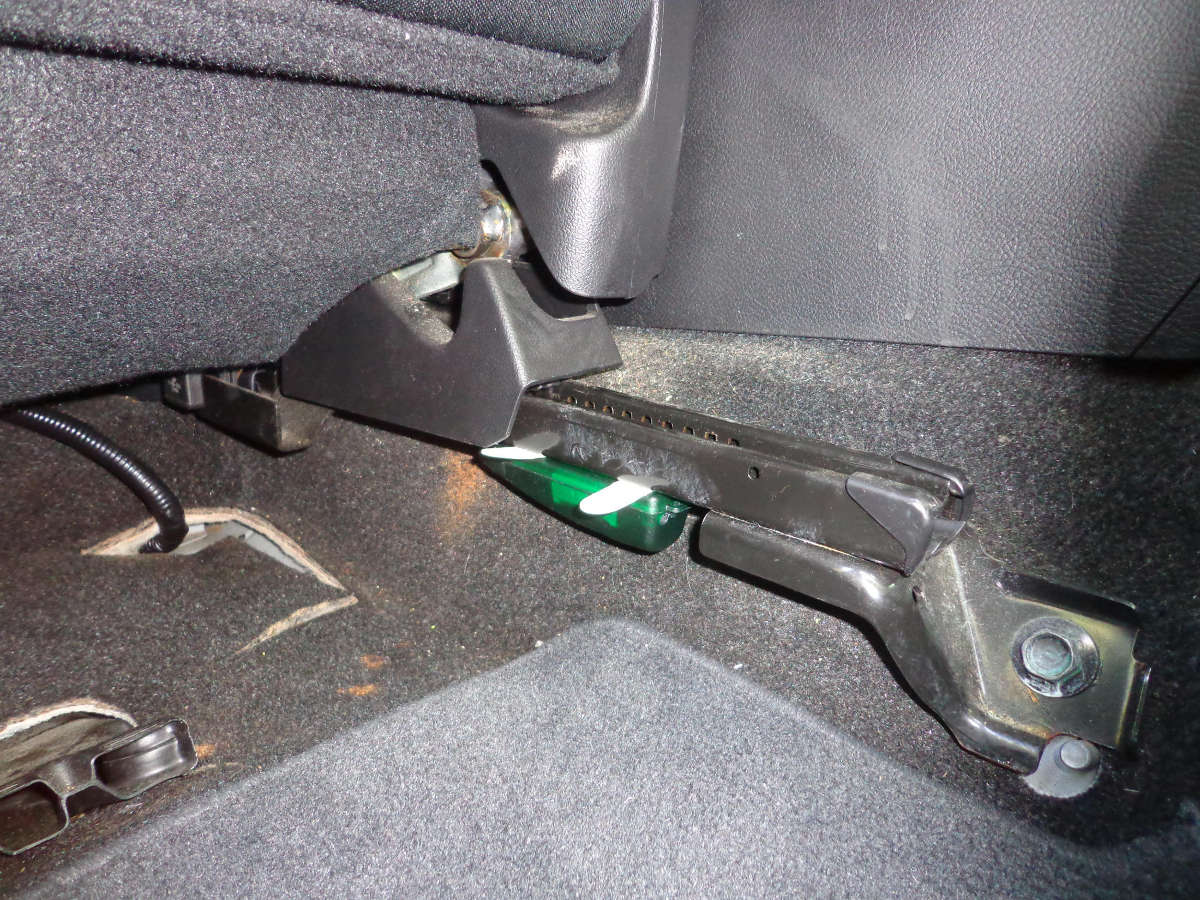
A convenient location on the driver's seat was chosen for easy placement of the X2-2 logger. Specifically, the bracket that mounts the seat to the car body. The +X axis pointed towards the front of the car and the +Z axis pointed downward. This experiment did not consider the X and Y axes.
The following steps outline the procedures taken to collect vibration data on two different road conditions before and after the tires were changed.
- Started the X2-2 data logger and drove to the first road course segment.
- Noted the date and time when the first road course started.
- Drove for at least 6 minutes on the first road course using the cruise control to maintain a consistent speed.
- Noted when the course completed.
- Continued to the second road course and noted the start time. Again, a consistent speed and driving habit was maintained.
- Noted when the course was completed.
- Parked the car and stopped the logger.
- Bought new tires at a reputable car service center. Sat in the waiting room for hours. Watched other customers receive service, even though they arrived an hour later. Got frustrated. Gave the manager the evil eye. Rejoiced when the car was finally done. Cried after paying the bill.
- Repeated the two test courses according to steps 1 through 7.
An R script was developed to analyze the test data (see Appendix A of test report). The script converted the accelerometer data to the frequency domain using a Fast Fourier Transform (FFT) function. The FFT function analyzed 1024 samples, or 4 seconds of data, and created a spectral response between 0 Hz and 128 Hz. Consecutive segments of data were taken from the file until the entire 2 minute file was processed. All the FFT results were averaged together into a single spectral plot summarizing the entire 2 minutes. This method averaged out intermittent changes in driving behavior and increased the signal-to-noise ratio of the results.
The script used the average spectral response to calculate the total RMS acceleration Grms/√Hz between 0.5 Hz and 128 Hz. Establishing the lower bandwidth at 0.5Hz removed the affects of gravity.
The script saved the output data as a text file, which was later imported into a spreadsheet to access better plotting capabilities.
Results
R is not particularly flexible with formatting plots so the figures below were generated using OpenOffice Calc. The table compares the total RMS acceleration for each test condition.
| Road Condition | Old Tires (Grms/√Hz) | New Tires (Grms/√Hz) | Change in Total Vibration (%) |
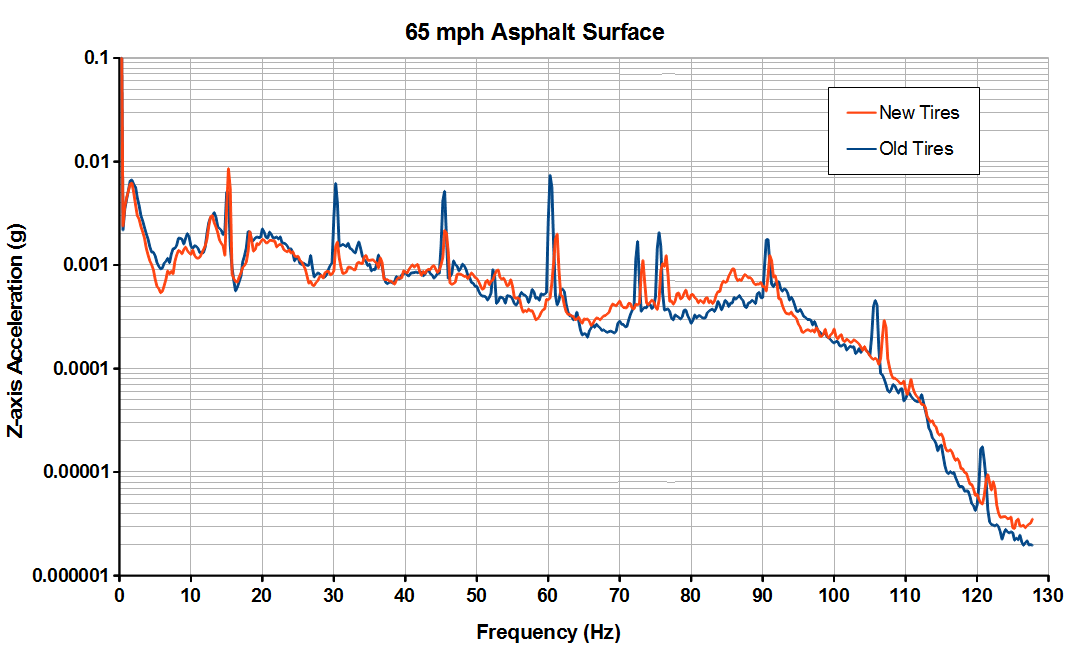
| 65 mph Asphalt | 0.002698 | 0.002275 | -15.7 |
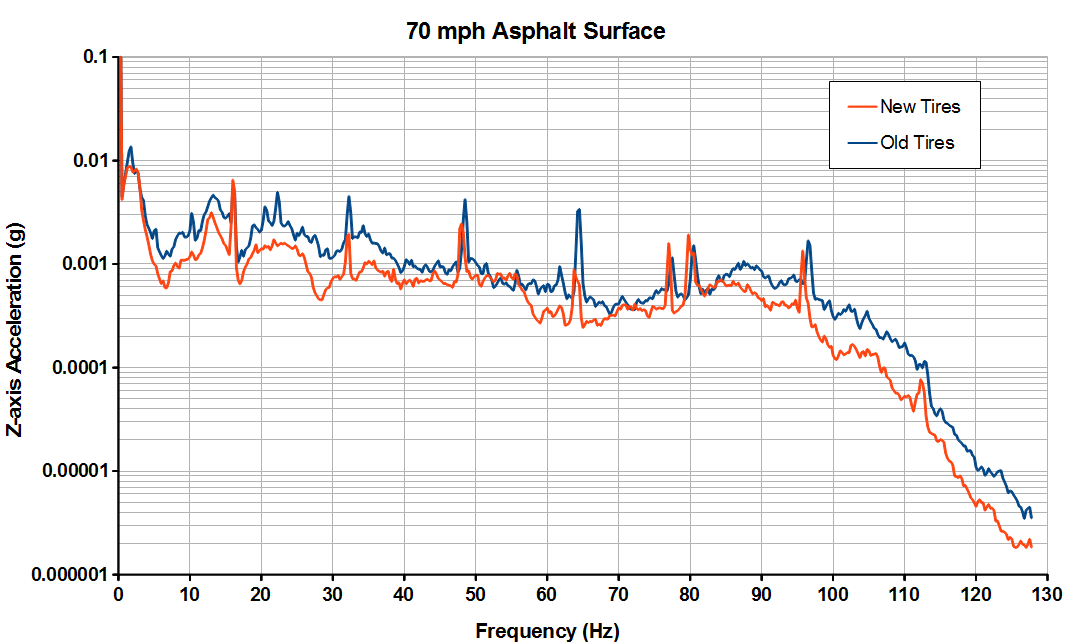
| 70 mph Asphalt | 0.003797 | 0.002832 | -25.4 |
Discussion
The figures illustrate the performance differences between the old and new tires. The distinct spiked peaks are due to the rotating wheels. Notice that the primary frequencies are 15.2 Hz at 65mph and 16.3 Hz at 70mph, which corresponds to the 24 inch diameter wheel spinning at each speed. Subsequent peaks are harmonics of the primary frequency. The new tires (red line) produced a reduction in the vibration peaks over the old tires (blue line). This improvement was evident to the driver as smoother feel at the steering wheel. The slight shift in frequency peaks between test runs is likely due to slight differences in the speed control setting. The table lists the total RMS vibration in the z-axis across the bandwidth of 0.5 to 128 Hz. A significant reduction in total vibration was observed at both driving speeds, which made a noticeable improvement to the cabin noise.
Conclusion
The new tires made a significant improvement to the ride experience. The most obvious change was the reduction in tire harmonics but this could have been due to the re-balanced rims (a standard practice after installing tires) rather than the new tires. The overall reduction in spectral vibration illustrated in figures reduced the cabin noise and made the Mazda3 more enjoyable at interstate driving speeds. New tires not only improve safety but also can provide a more comfortable and quieter ride.